If you are using Google Analytics 4 you might have noticed there is an option in the ‘Reporting’ menu called DebugView.
You can use DebugView to validate your analytics configuration and data which is being sent to Google Analytics 4. Here is a brief introduction to this topic.
Introduction to DebugView in Google Analytics 4
Debugging your implementations is an important step in validating your analytics configuration.
It could take a few minutes or several days to troubleshoot the issues in analytics depending upon your skills and experience. But in the case of Google Analytics 4, it’s very simple because of the special real-time report provided by GA4 called DebugView.
DebugView allows you to monitor your website’s event data in real-time along with all the custom parameters and user properties set.
To cut a long story short, DebugView is a real-time report which isolates and shows data only from a specific device where debug mode is enabled.
Debug mode: When debug mode is enabled on your device, your data will be sent in Google Analytics in real-time only (without processing it). This data will be filtered out and isolated from other devices (regular users) who are also generating events on the website or app and hence your actual data (dimensions and metrics in analytics) is not inflated.
Debug mode allows you to see only the data generated by your device while validating analytics and also solves the purpose of having separate data streams for staging and production (no more separate data streams for staging and production).
Caveat: DebugView in Google Analytics 4 only shows you real-time reports (events data) for the past 30 minutes. You can validate your analytics configuration only by generating events in real-time. You can not see any data in the DebugView generated before the 30 minutes time frame.
Debugging tools needed
Before you start using DebugView in GA4 you must enable debug mode in your device and for that, you need to have certain tools. These tools are different based on the platform.
Please follow Google’s documentation as well here: Validate your Analytics configuration with DebugView
To enable on a mobile device or browser you need
- Websites: Google Analytics Debugger Chrome Extension
- iOS Apps: An iOS device (iPhone or iPad)
Since we are focusing only on browser websites, we will use the Google Analytics Chrome extension.
Using DebugView in Google Analytics 4
Now let’s deep dive into how to use DebugView in Google Analytics 4. Follow the below steps to understand the concept in more detail.
Note: You will need to install Google Analytics Debugger Chrome Extension before proceeding to the steps.
Step 1: Enable the Google Analytics Debugger Chrome Extension (click on the extension to enable it).
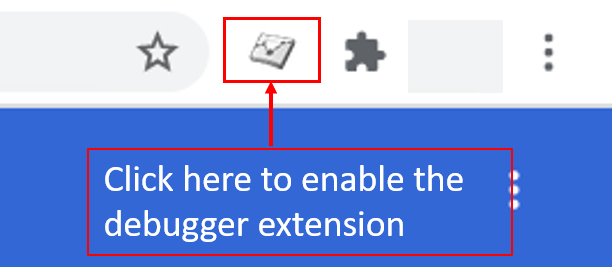
Once the extension is enabled it will look like below

Step 2: Now navigate to your website and just right click on the page and select ‘Inspect’.
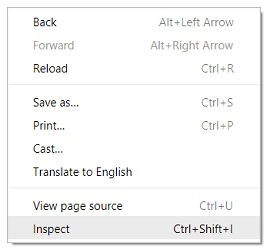
This will open the developer console window at the bottom of a web page:
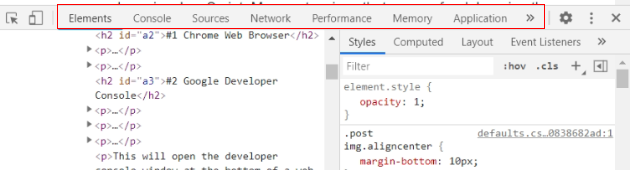
Step 2.1: Click on ‘Console’.
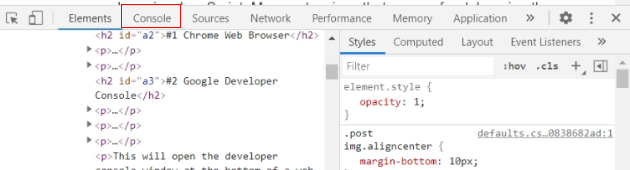
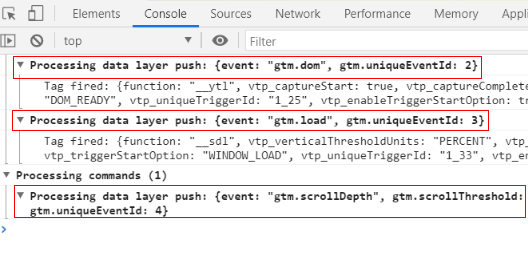
Step 2.2: Now refresh the page and you will see comments in the console like below. It means you have successfully enabled debug mode.
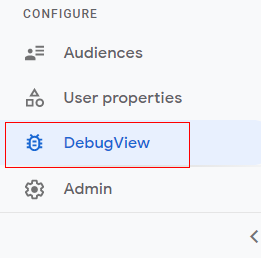
Step 3: Now navigate to your Google Analytics 4 property and click on ‘DebugView’ from the ‘Reporting’ menu.
Step 4: You will get a real-time reporting view like below.
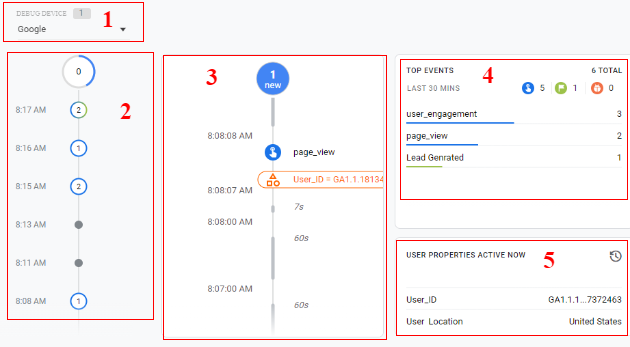
I have divided the report into five sections. Now let me explain each section in detail.
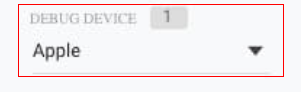
Section 1: This section gives you details of the debug device used. Since we are using Google Analytics Debugger Chrome extension it is showing the debug device as ‘Google’. If you are using any other device to debug, it will show you the debug device accordingly (like Apple, Android).
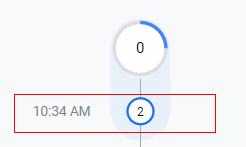
Section 2: This section gives you details of events happening every minute. You can call it a minutes stream timeline. Each part of the timeline will give you a count of events that happened for the corresponding minute on the website. This stream shows a series of circles, one circle for each of the most recent 30 minutes.
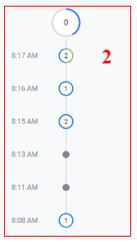
You can see in the above image one event is fired at 8:08 AM, then there are no events fired till 8:14 AM, then there are two events fired at 8:15 AM, one event at 8:16 AM, and again two events at 8:17 AM.
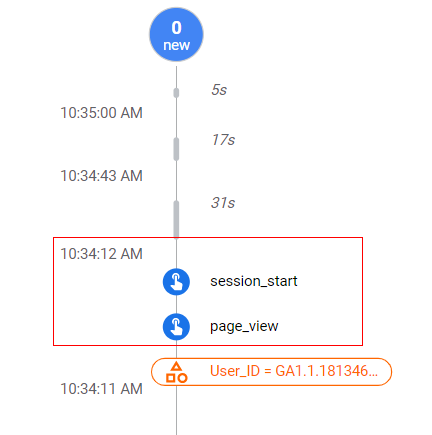
Section 3: This section is called seconds stream. By default, you can see a list of events logged in the last 60 seconds. Each event displays a timestamp that corresponds to the time of its logging on the development device. You can click an event to see a list of associated parameters.
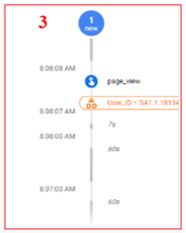
As you can see in the image above, there is a page view call firing at 8:08:08 AM. You can also see the user property is also set at the same time as the associated parameter for the pageview event.
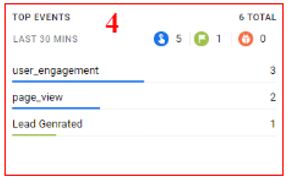
Section 4: This section gives you details of top events and their count for the last 30 minutes. You can see in the below image there are three ‘user_engagement’ events, two ‘page_view’ events, and one ‘lead generated event’.
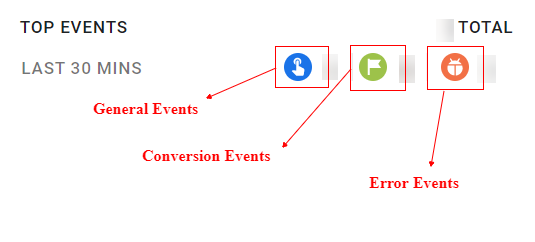
The events are categorized as below
- General events: These are general events that you have configured for your GA4 property like page_view, user_engagement, scroll, etc.
- Conversion events: If you have marked a particular event as a conversion event, it will be reflected here.
- Error Events: If there are any errors while debugging, it will be reflected in error events.
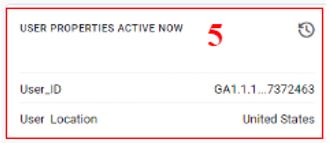
Section 5: This section gives details about user properties. As you can see from the image below I have set ‘User_ID’ and ‘User Location’ as user properties. These properties are the latest state of the user properties for the currently selected development device.
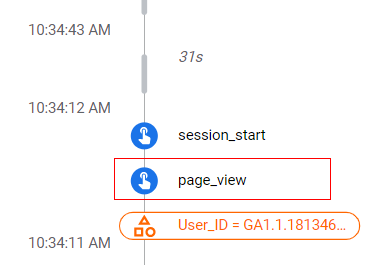
Step 5: Now let’s click on any event in the ‘minute stream’ timeline.
Immediately, you can see the list of events happening for the corresponding events in the ‘seconds stream’ like below.
Step 6: Now let’s click on the ‘page_view’ event.
Step 7: Once you click you will get the details of parameters and user properties for the selected event as below.
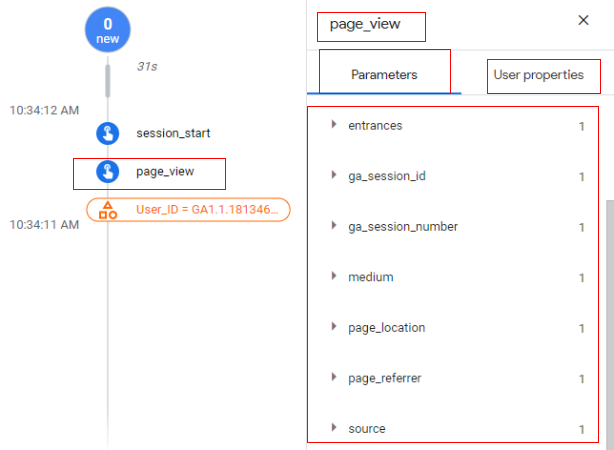
You can click on any of the parameters and it will give you details of the value passed for the selected parameter.
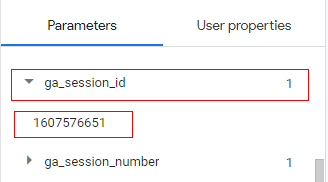
As you can see from the above image, ‘1607576651’ is my session-id passed in the ‘ga_session_id’ parameter.
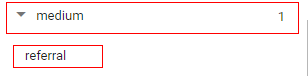
You can also click on the different parameters to see their value. Let’s say you want to check the medium by which traffic came, you can just click on ‘medium’ and as you can see in the image below its value is showing as ‘referral’.
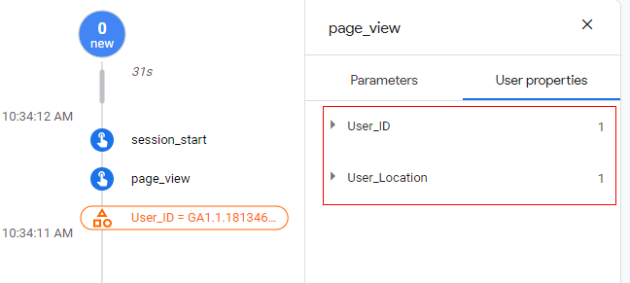
Step 8: Now let’s check user properties set on the page view event. Click on ‘User Properties’.
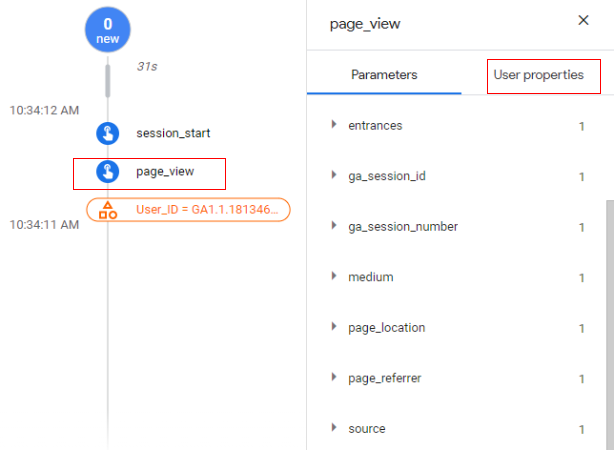
As you can see from the below image, for the page_view event, there are two user properties available, ‘User_ID’ and ‘User Location’.
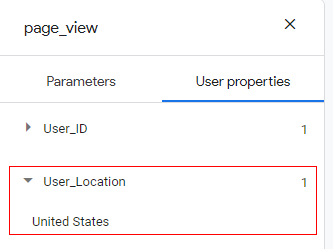
These are custom user properties that I have created and now I can click on them to validate what data is passing to analytics. For example, I have set ‘User_Location’ as user property based on their geolocation, and it has a value of ‘United States’. This means my analytics configuration is working properly.
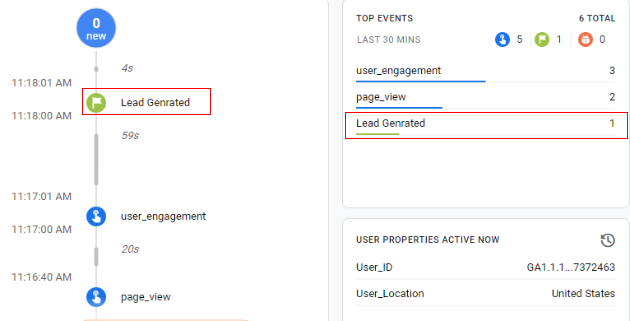
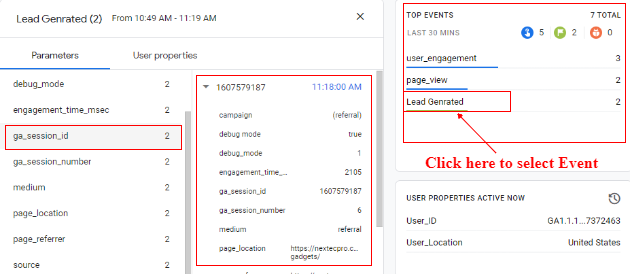
Step 9: You can also validate conversions in DebugView. For example, I have set up a conversion event when somebody submits a form. I have given it the name ‘Lead generated’.
Now let’s fire the conversion event on the website, and you can see it as a conversion event in DebugView, as below.
You can select the event in ‘seconds stream’ to get more details on custom parameters and user properties sent with the conversion event.
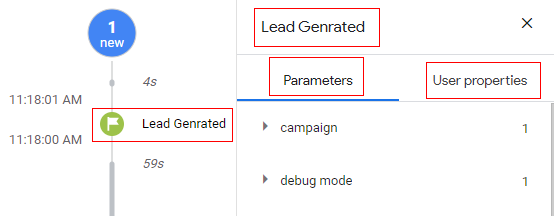
You can also click on the conversion event from the ‘Top Events’ section and then select any parameter to get its details.
So, that is how you can use DebugView in Google Analytics 4.
Just as shown in the above steps, you can select any event either from ‘minute stream’ or ‘seconds stream’ and even from the top events to debug it and validate all the parameters and user properties being sent.