In Google Analytics 4 you can create your own custom insight cards. You can create up to 50 custom insight cards per property.
Follow the below steps to create a custom insight in GA4:
Note: You will need collaborate or edit permissions to create, edit, and share insights.
Step 1: Log in to your Google Analytics 4 account. Click on the ‘Home’ in the reporting menu.
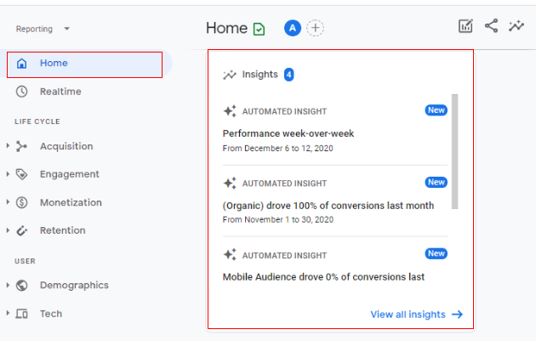
As you can see from the above image, insight cards are available by default.
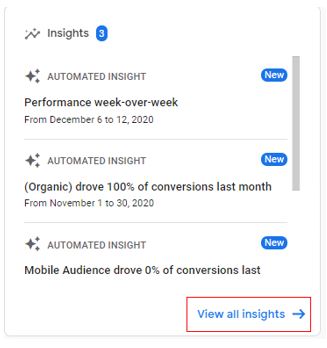
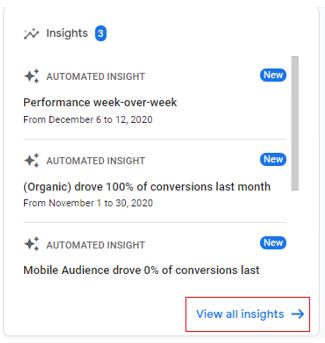
Step 2: Click on the ‘View All Insights’ option.
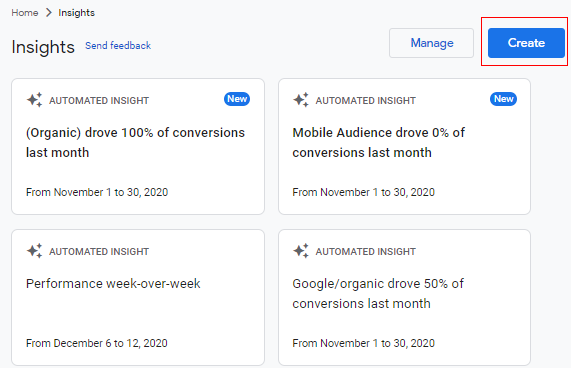
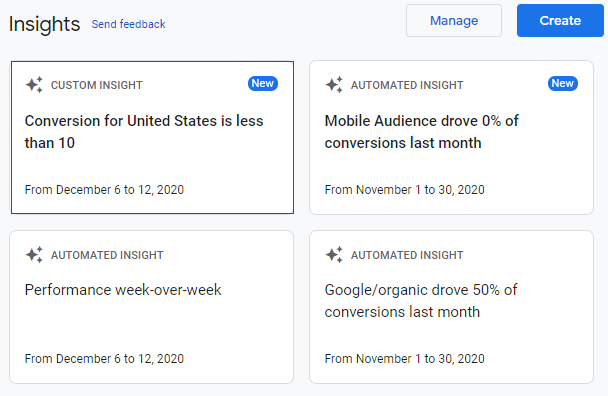
Step 3: Once you click on ‘View all insights’ you will see an overlay that will appear like the below image providing you all insight cards like below. Click on ‘Create’.
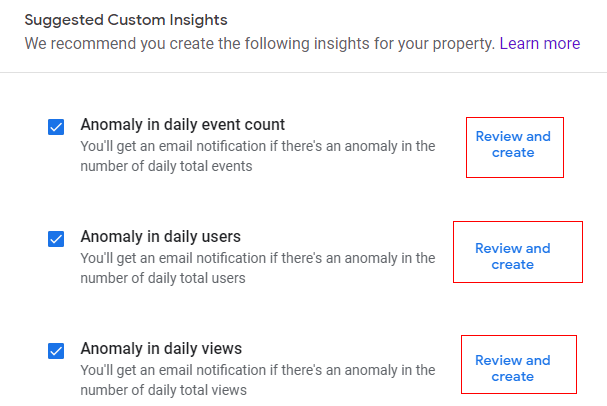
Step 4: An overlay will appear like below where you get an option to create your custom insight either using ‘Suggested custom insight’ or ‘Start from scratch’.
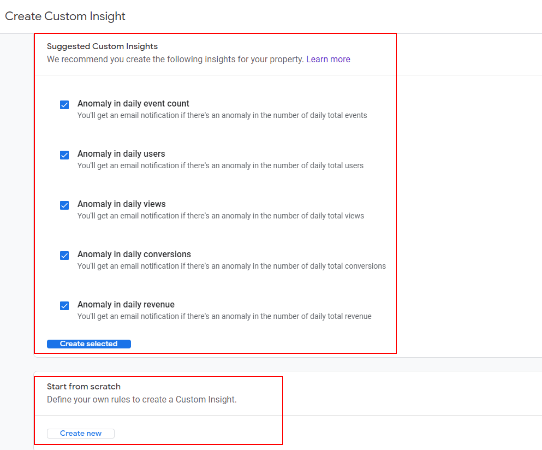
You can select the check box for each insight you want to create and then click on ‘Create selected’.
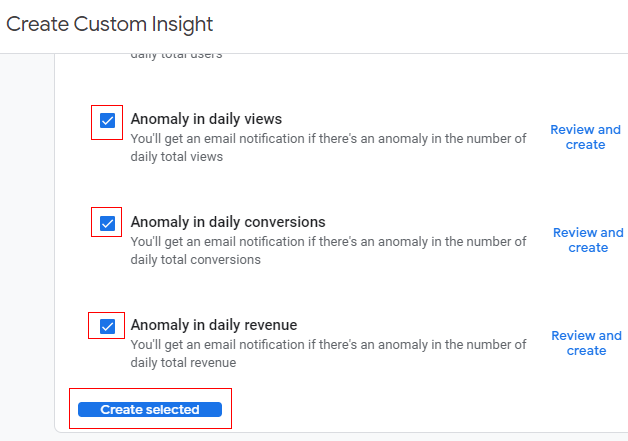
If you want to use a suggestion as a template, click ‘Review and create’ in the row for that insight.
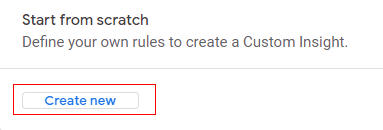
To create your custom insight, click ‘Create new’ under ‘Start from scratch’.
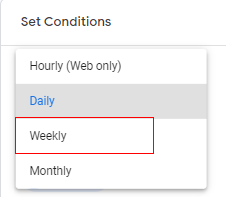
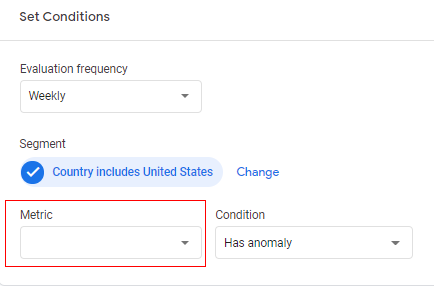
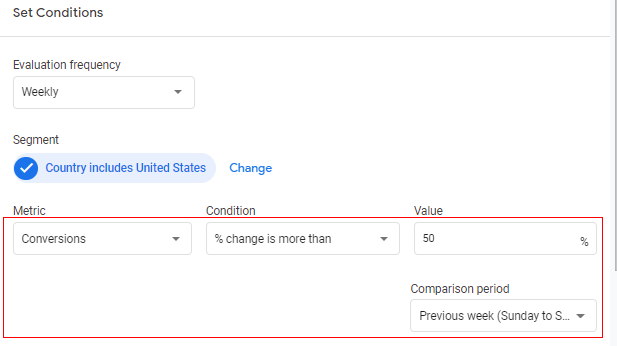
Step 5: An overlay will appear like below where we need to define the conditions for the custom insight. Click on the drop-down menu available under ‘Evaluation frequency’.
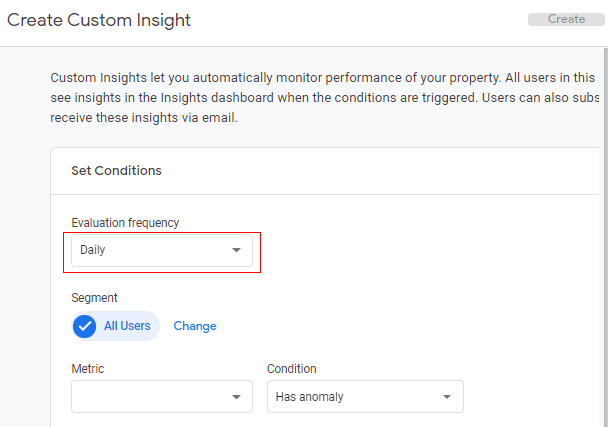
Step 6: Select the frequency at which you want to generate insight. For example, I am selecting ‘Weekly’.
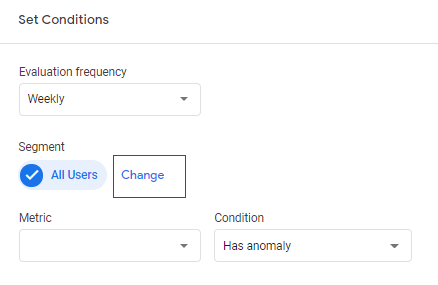
Step 7: Now you need to define the segment of users to be used for the insight. You can keep it as ‘All Users’ which is selected by default and move to Step 9, or if you want to change the user segment, you can click on ‘Change’.
Step 8: An overlay will appear at the right-hand side like below.
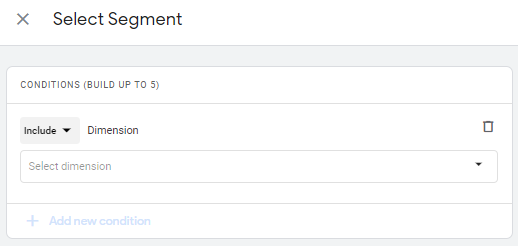
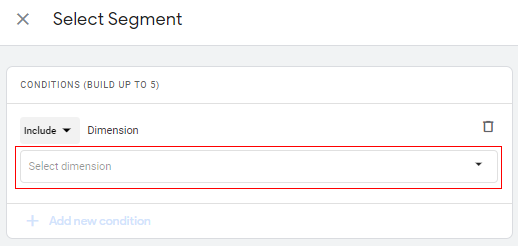
Step 8.1: A drop-down menu is available with the default condition as ‘Include’. You can click on the drop-down if you want to change the condition where you will get an option to either ‘Include’ or ‘Exclude’.
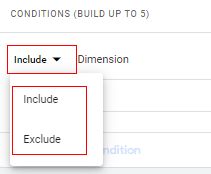
This condition basically to define whether to add (include) user in a segment or to remove (exclude). In our case, I am going to keep it as ‘Include’.
Step 8.2: Now click on the drop-down ‘Select dimension’.
Step 8.3: A list will appear like below. You can scroll down or up to select a dimension or you can simply type it in the input box available.
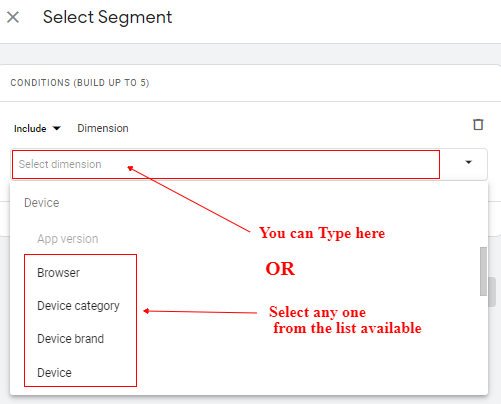
Once you selected the dimension another drop-down will be visible as ‘Dimension values’ as below.
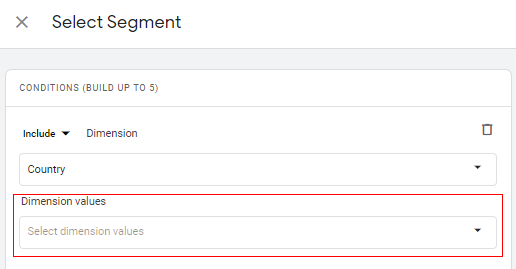
Step 8.4: Click on the drop-down under ‘Dimension value’.
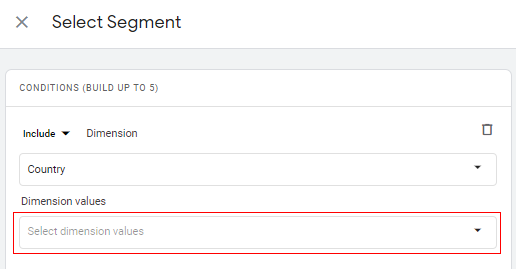
Step 8.5: A list will appear like below. You can scroll down or up to select a dimension value or you can simply type it in the input box available.
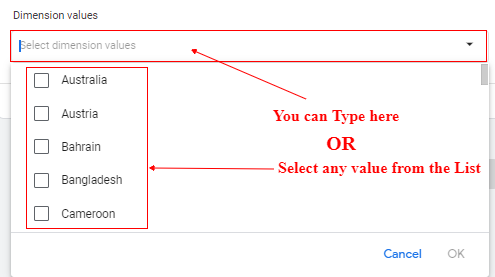
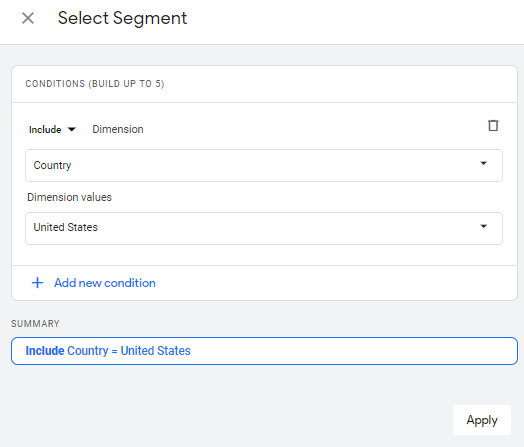
Your segment will look like the one below.
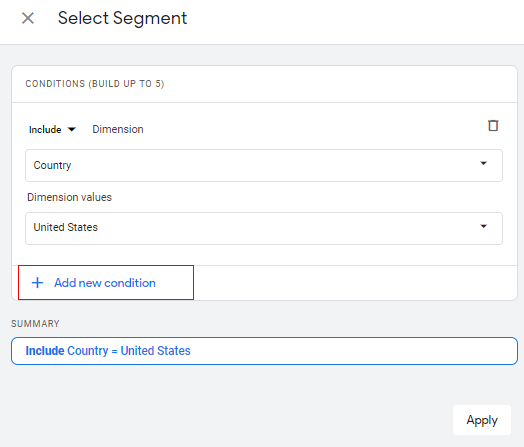
If you want to add more conditions you can add up to five conditions. Just click on ‘Add new condition’ just like we did in Step 8.
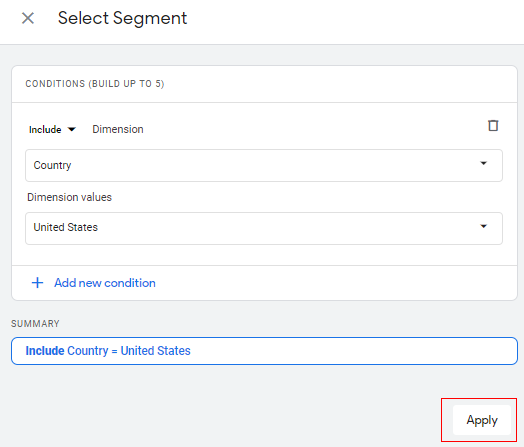
Step 8.6: After you have added all the conditions, click on ‘Apply’.
Step 9: Now click on the drop-down available under ‘Metric’.
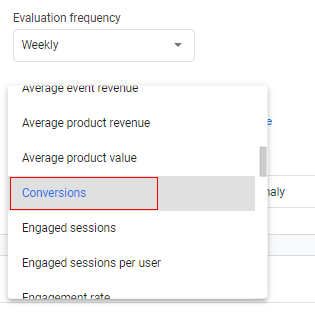
Step 10: From the populated list, Select the metric for which you want to create the custom insights.
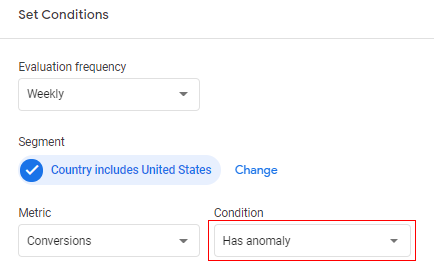
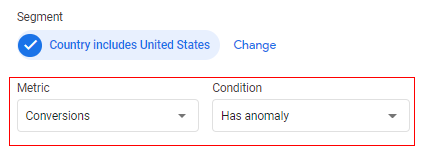
Step 11: Now click on the drop-down available under ‘Condition’ to specify the rule.
You will get the below options.
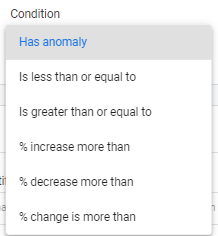
Has anomaly:
If you select this option your insight will be generated if there are any sudden spikes or dips in the selected metric. Analytics determines when the change in the metric is anomalous, and you do not need to enter a value.
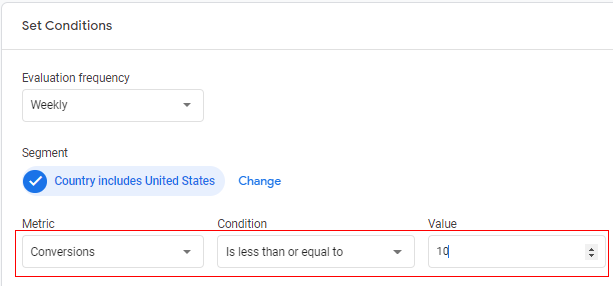
Is less than or equal to:
If you select this option, you need to specify the value for which condition will be evaluated. This will be a numeric value.
For example, if I put the value as 10, my insight will be generated whenever the selected metric is in the range of 10 or less. In our case, if my conversions reduce to 10 or less in any week (evaluation frequency set to weekly) it will generate the insight.
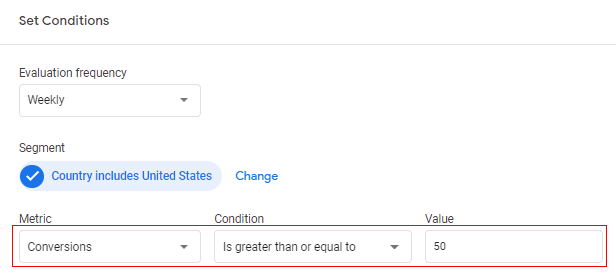
Is greater than or equal to:
If you select this option, you need to specify the value for which condition will be evaluated. This will be a numeric value.
For example, if I put the value as 50, my insight will be generated whenever the selected metric is in the range of 50 or more. In our case, if my conversions increase to 50 or more in any week (evaluation frequency set to weekly) it will generate the insight.
% increase more than:
If you select this option as a condition, you need to specify the value for which condition will be evaluated. This will be a percentage value. You also need to provide ‘Comparison Period’ from the drop-down available.
For example, if I put the value as 50, my insight will be generated whenever the selected metric will cross the 50% increase as compared to the comparison period selected. The comparison period depends on how we set evaluation frequency.

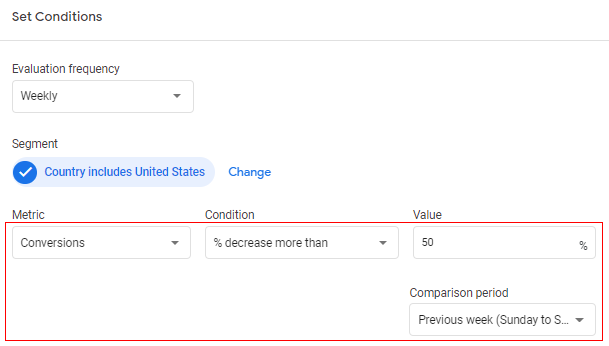
% decrease more than: If you select this option as a condition, you need to specify the value for which condition will be evaluated. This will be a percentage value. You also need to provide the ‘Comparison period’ from the drop-down available.
For example, if I put the value as 50, my insight will be generated whenever the selected metric will cross the 50% decrease as compared to the comparison period selected.
% change more than:
If you select this option as a condition, you need to specify the value for which condition will be evaluated. This will be a percentage value. You also need to provide the ‘Comparison period’ from the drop-down available.
For example, if I put the value to 50, my insight will be generated whenever the selected metric will cross the 50% change (increase or decrease) as compared to the comparison period selected.
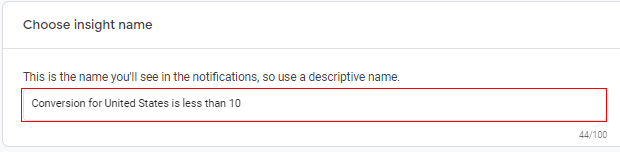
Step 12: The next step is to give a descriptive name to the insight. This is the name you’ll see in the notifications, so use a descriptive name. For example, ‘Conversion for the United States is less than 10’. Type into the input box available under ‘Choose insight name’.
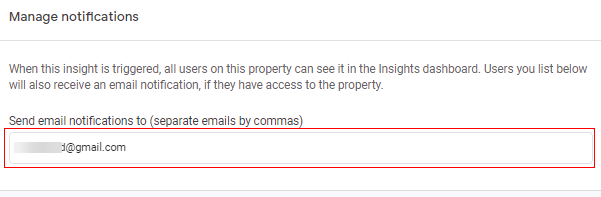
Step 13: In this step, we need to manage notifications for custom insights. By default, all users on property see all triggered custom insights in the insight dashboard. If there are users who want to be notified by email, then you enter their email addresses in the available input box.
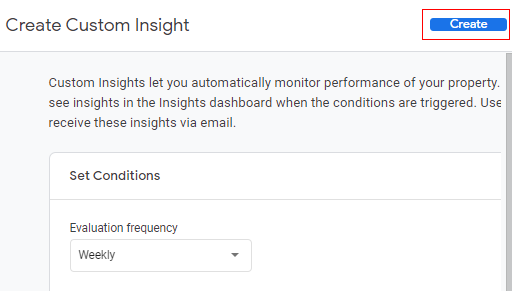
Step 14: Now click ‘Create’ in the upper right corner.
Congratulations! You have successfully created a custom insight in Google Analytics 4 (GA4). You can see your custom insight available under ‘View All Insights’.
Managing custom insights in GA4
For each custom insight, you can turn email notifications on or off for property users. You can delete the insight as well.
Follow the below steps to know more.
Step 1: Click on the ‘View all insights’ option.
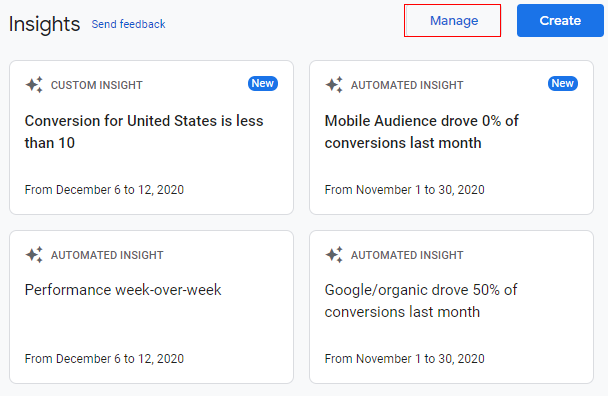
Step 2: Once you click on ‘View all insights’ you will see an overlay that will appear as below, providing you with all insight cards. Click on ‘Manage’.
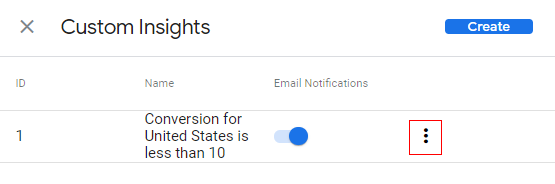
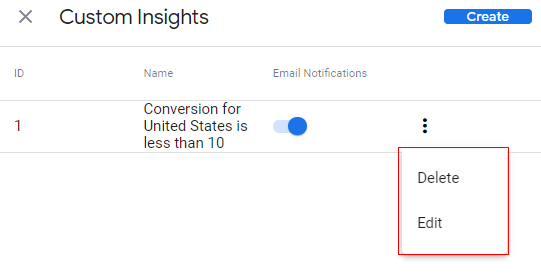
Step 3: An overlay will appear as below, with the list of custom insights. Click on the three vertical dots in front of the insight which you want to modify.
Step 4: You get an option to either ‘Delete’ the insight or to ‘Edit’ the insight.
If you want to delete the insight you can click on ‘Delete’ and if you want to edit the insight you can click on the ‘Edit’ option to do the required changes.
That is how you can manage the custom insights.
Summary
Data and analytics are the basics to understand the users in a more detailed manner. Insights provide the details of changes in data and analytics which can be used while taking important business decisions.
Google Analytics 4 (GA4) provides you with default automated insights on the standard KPI metrics. You also get an option to create your custom insights based on your business KPI’s.
You have an option to get notification alerts whenever there is a sudden change in the metrics and take necessary actions. This is how you can create a custom insight in Google Analytics 4.