In GA3 or universal analytics what was called segments are represented as comparisons in GA4.
In Google Analytics 4, comparisons allow you to evaluate subsets of your data side by side. For example, you might compare all data generated by desktop devices and all data generated by mobile devices.
In GA4, comparisons take the place of segments and filters that you’ve used in Universal Analytics properties.
Just like segments, comparisons allow you to isolate and analyze a subset of data. For example, if you find that users from a particular device category (let’s say mobile) are no longer interacting in the same volume as they normally have, you can see whether your website is having any issues for the particular device type. If found true, you can take the necessary actions to make your website more user friendly and interactive for mobile devices.
Where can you build comparisons?
You can build comparisons in all the reporting tabs available in GA4
- Home Tab
- Real-time
- Acquisition Overview
- User Acquisition
- Traffic Acquisition
- Engagement Overview
- Engagement >> Events
- Engagement >> Pages and Screen
- Monetization Overview
- Monetization >> Ecommerce Purchase
- Monetization>> In-app Purchases
- Monetization >> Publisher Ads
- Retention >> Overview
- Demographics >> Overview
- Demographics >> Demographics details
- Tech Overview
- Tech >> Tech details
- Audiences
You create comparisons by creating conditions based on dimensions and dimension values. For example, all users vs users from country equals ‘United States’.
Now let’s build a comparison to understand this concept in more detail.
How to build comparisons
Follow the steps below to build a comparison
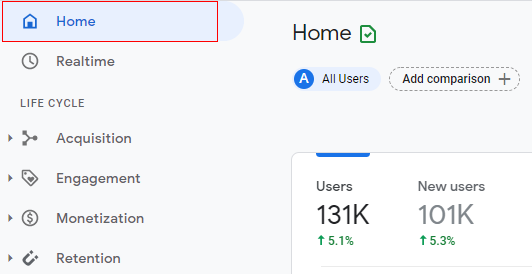
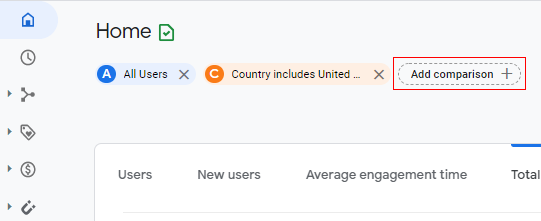
Step 1: Log in to your Google Analytics 4 account and select any reporting tab where you want to build the comparison. In this example, I am selecting ‘Home’ tab.
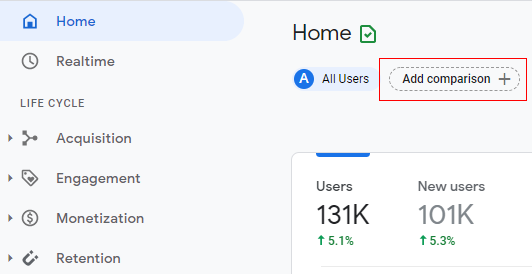
Step 2: Click on ‘Add comparison’.
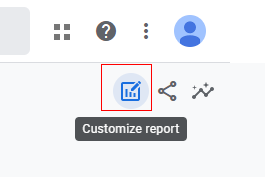
Another way to build a comparison is by clicking on the ‘Customize report’ option available at the top right corner.
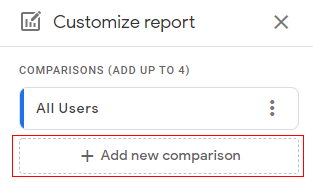
An overlay will appear on the right-hand side, now click on ‘+ Add new Comparison’.
Step 3: An overlay will appear on the right-hand side, as below.
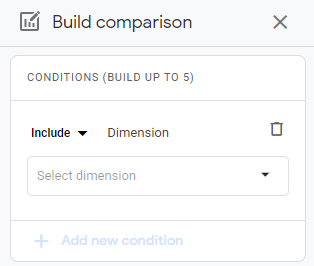
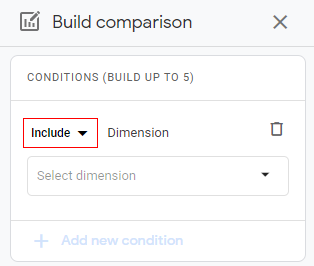
Here we need to define the conditions for the comparison based on dimensions and dimension values. Now click on the drop-down marked ‘Include’.
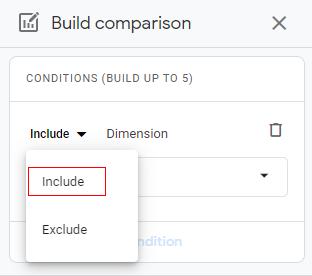
Step 4: You will get a pop up like below to select the condition. The conditions available is ‘Include’ (to include a particular dimension for comparison) and ‘Exclude’ (to exclude a particular dimension from the comparison).
Select your condition. Here I am selecting ‘Include’.
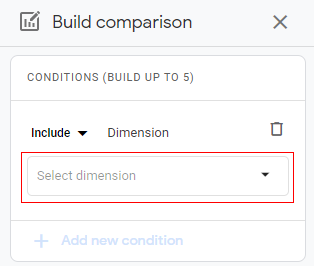
Step 5: Now click on the drop-down menu ‘Select dimension’.
Step 6: A list will pop up, like below. You can scroll down or up to select a dimension or you can simply type it in the available input box.
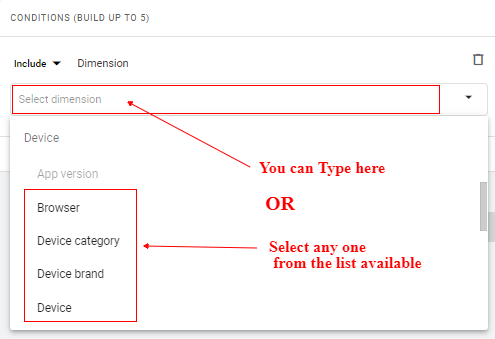
Once you selected the dimension another drop-down will be visible as ‘Dimension values’ as below.
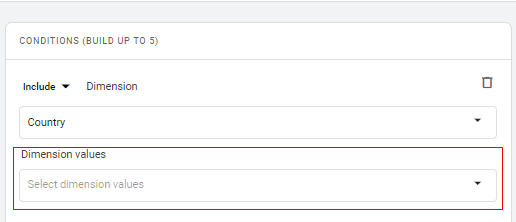
Step 7: Click on the drop-down under ‘Dimension values’.
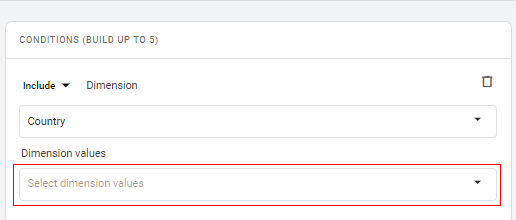
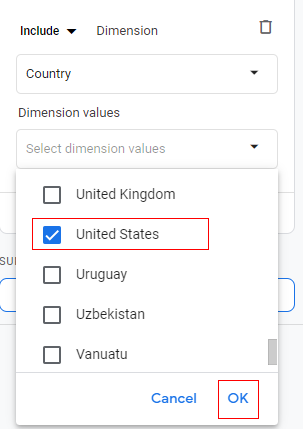
Step 8: A list will appear, like below. You can scroll down or up to select a dimension value or you can simply type it in the available input box.
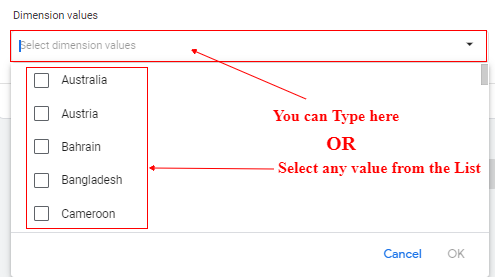
You can also select multiple values. Note that ALL dimension values selected for the same condition are evaluated with ‘OR’ logic. For example, if you select ‘United States’ and ‘Canada’, users from both countries will be included in the comparison. In our example, I am selecting only ‘United States’.
Once the dimension values are selected, click on ‘OK’.
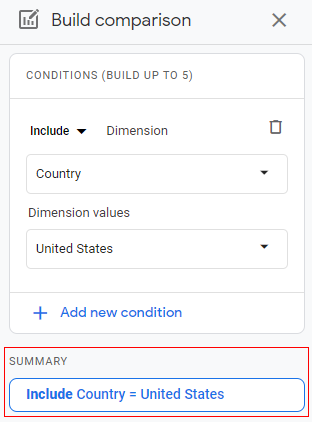
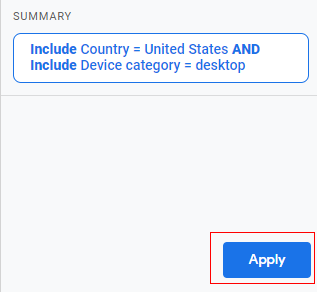
Your comparison will look like below. It will also provide you with a summary of the dimensions and conditions used while building the comparison.
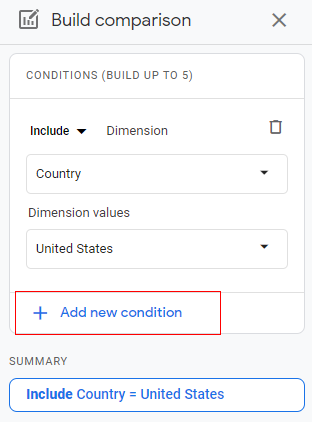
Step 9: If you want to add more conditions to your comparison you can click on ‘+ Add new condition’.
Step 10: Repeat the steps for selecting dimensions and their value (Step 3 to Step 8).
As an example of adding a new condition, here I will be selecting device category = desktop.
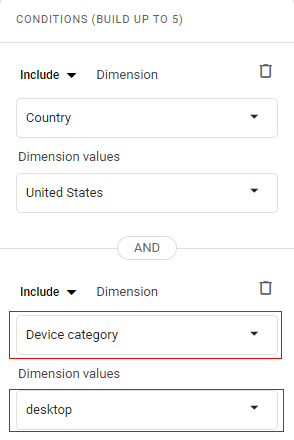
Note that multiple conditions within the same comparison are evaluated with ‘AND’ logic. For example, for (Country = United States) AND (Device Category = desktop) users from United States AND those who use desktop will be included in the comparison.
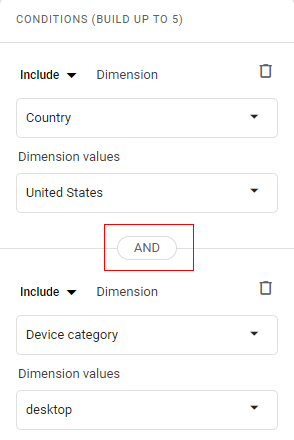
You can add up to five conditions in a single comparison.
Step 11: Once you have added all the conditions, click on ‘Apply’.
Congratulations! You have successfully built a comparison in Google Analytics 4.
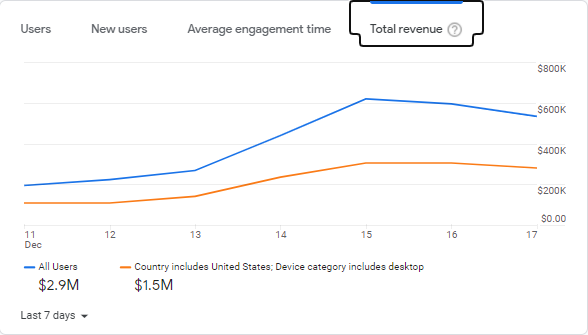
You can now see the data for the selected comparison side by side with all users. A color-coded version of the data appears for each comparison.
Comparison definitions appear at the top of your reports and remain in effect as you switch reports unless they are not applicable to the data in the report.
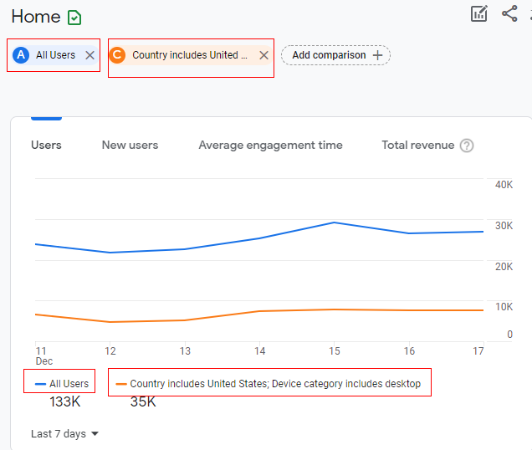
The blue line represents all users and the orange line represents the users from the comparison we built i.e. country = ‘United States’ AND device category = ‘desktop’.
You can click on various metrics available to check the performance of the users available in the comparison.
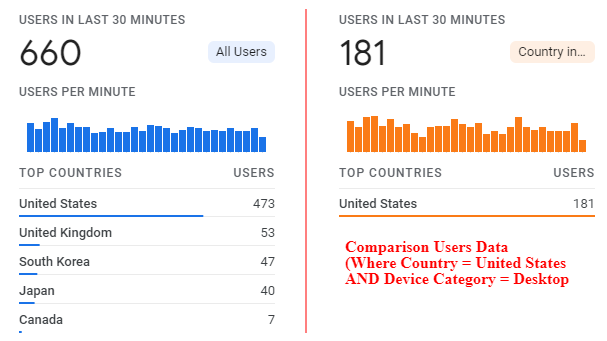
You can see different reports side by side with our comparison conditions.
Country report
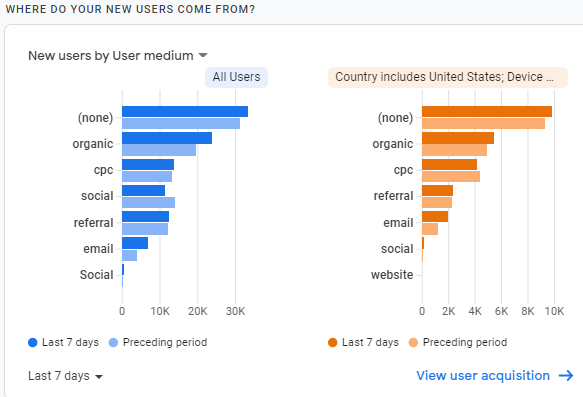
Source Medium report
Step 12: If you want to add more comparisons, you can build up to five multiple comparisons at the same time. Just click on ‘Add comparison’.
Repeat the steps for adding conditions to your comparison.
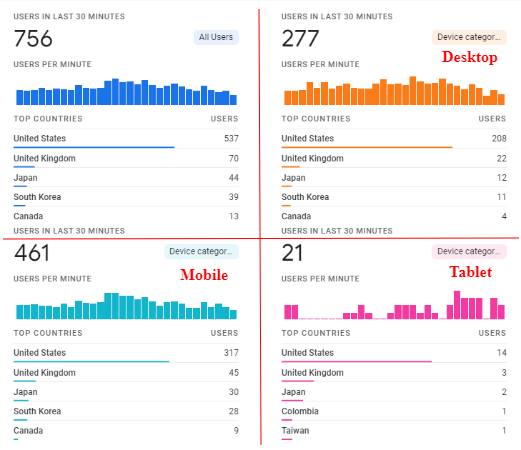
In the below image I have added four comparisons as:
- All users
- Desktop users
- Mobile users
- Tablet users
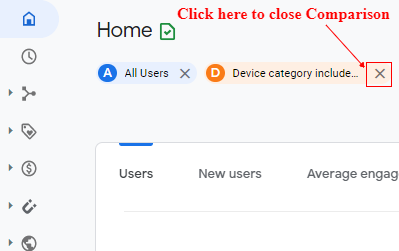
Step 13: If any time you want to close the comparison click the ‘X’ to the right of the definition.
Limitations
Since comparisons are temporally created segments there are a few limitations to it
- You cannot save the comparisons.
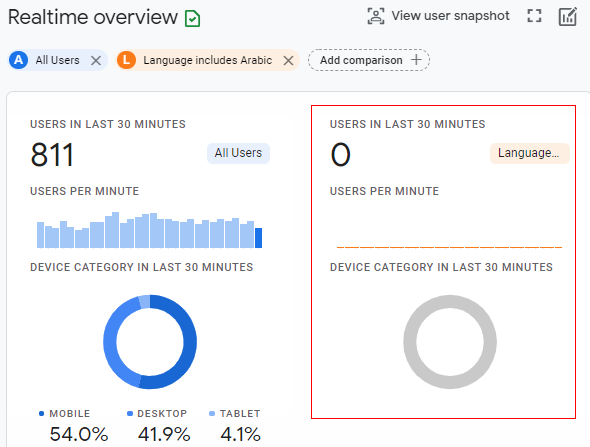
- If a report doesn’t support a condition, e.g. the report doesn’t include one of the dimensions, then a blank card appears for that comparison.For example, I have created a comparison for ALL users vs users who use the ‘Arabic’ language. In the below image you can see there are no users in real-time who uses ‘Arabic’ and hence it is showing a blank card.
Not all dimension values may be available. Some dimensions are not allowed to be excluded, while others are not available due to your comparison conditions configuration.
Summary
Comparisons allow you to isolate the data for specific users using the dimensions and hence you can analyze their performance for various metrics.
You can add up to five conditions in each comparison and you can create up to five comparisons at the same time. So, that is how you can build comparisons in Google Analytics 4.