You can access the ‘All Events’ report by following the steps below:
Step-1: Navigate to your GA4 reporting view.
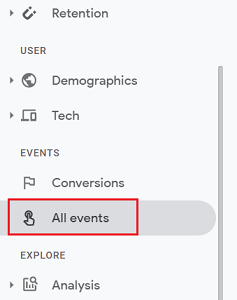
Step-2: Scroll down and then click on ‘All Events‘ report under ‘EVENTS‘:
Through the ‘All Events’ report you can do the following:
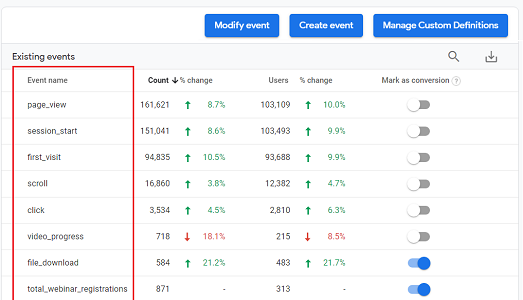
#1 You can see the complete list of all the logged (i.e. recorded) events in your GA4 reporting view.
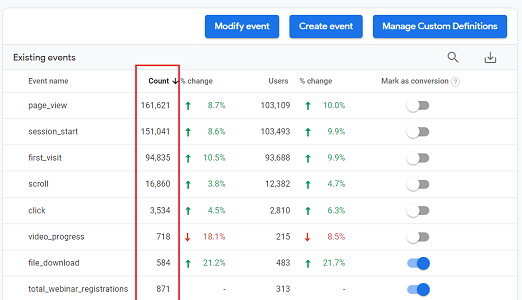
#2 You can determine how many times each logged event was triggered via the ‘Count’ metric:
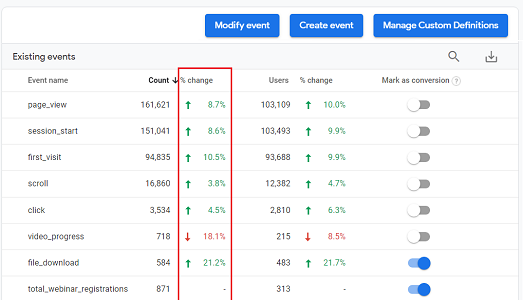
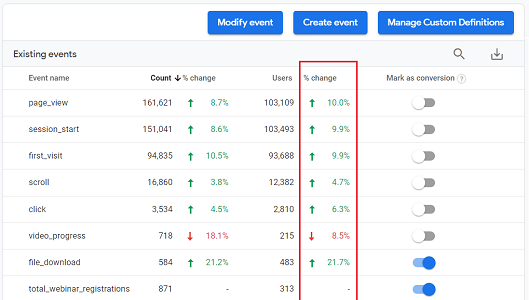
#3 You can determine the % change (i.e. the percentage of the rise or fall in relation to the old value) of count for each logged event via the ‘%change’ metric:
#4 You can determine the total number of users who triggered each logged event via the ‘Users’ metric:
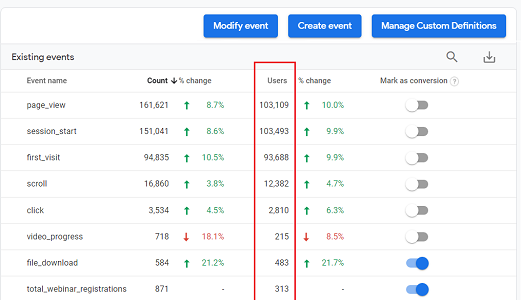
#5 You can determine the % change (i.e. the percentage of the rise or fall in relation to the old value) of users for each logged event via the ‘%change’ metric:
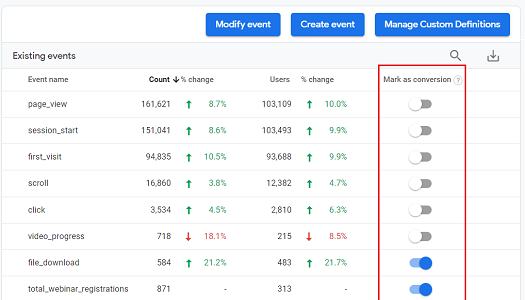
#6 You can enable or disable logged events as conversions by turning on or off the toggle switch under the ‘Mark as conversion’ column:
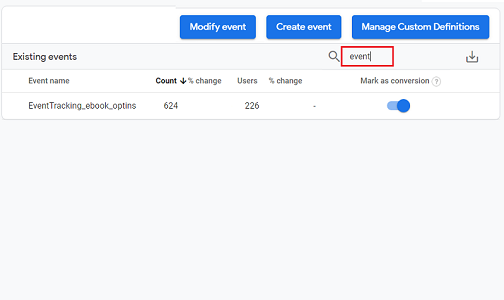
#7 You can search for a particular event by clicking on the magnifying glass button and then typing your search term:
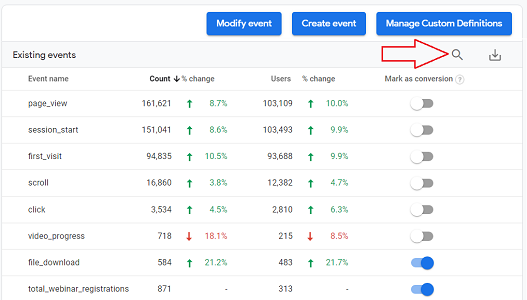
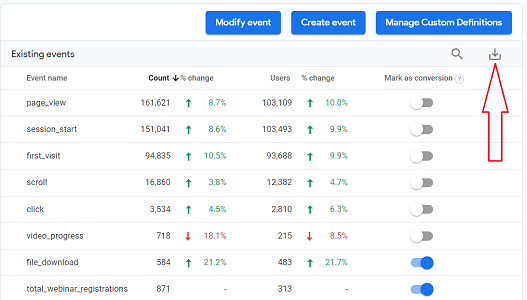
#8 You can download the ‘All Events‘ report as CSV by clicking on the download button:
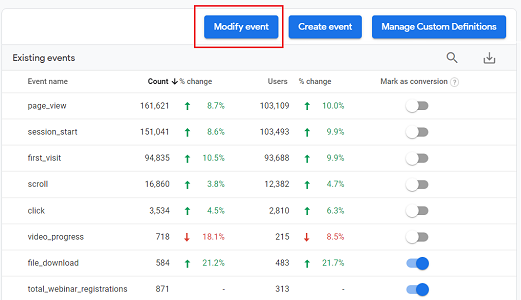
#9 You can modify an event by clicking on the ‘‘Modify Event‘ button:
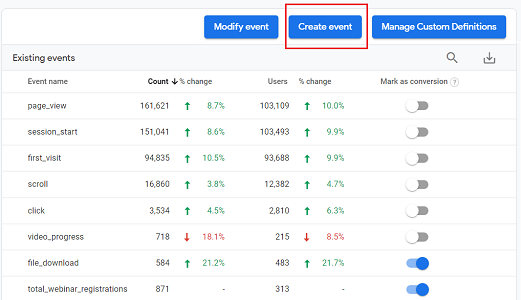
#10 You can create a new custom event from an existing event by clicking on the ‘Create Event‘ button.
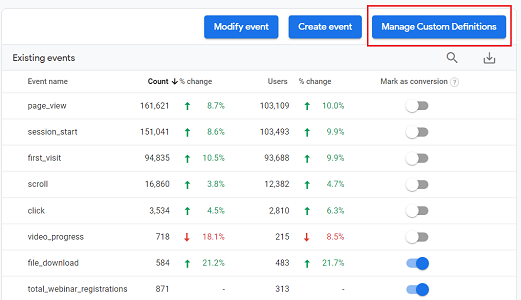
#11 You can create a new custom dimension or custom metric by clicking on the ‘Manage Custom Definitions‘ button:
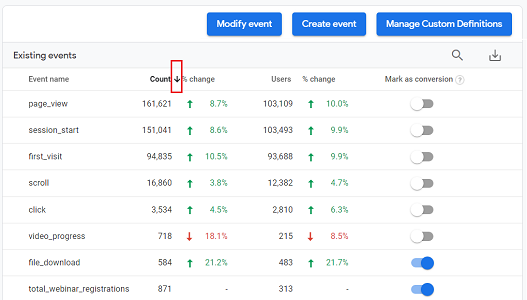
#12 You can sort the ‘Event Name‘, ‘Count‘ and ‘Users‘ metrics in ascending or descending order by clicking on the arrow button next to it.
For example, if you want to sort the ‘Count‘ metric in ascending order then click on the down arrow button next to it:
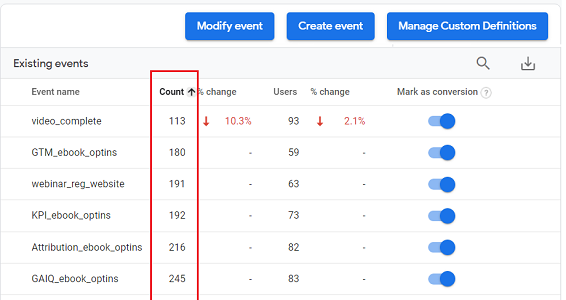
You should now be able to see the logged events list sorted by ‘Count’ in ascending order:
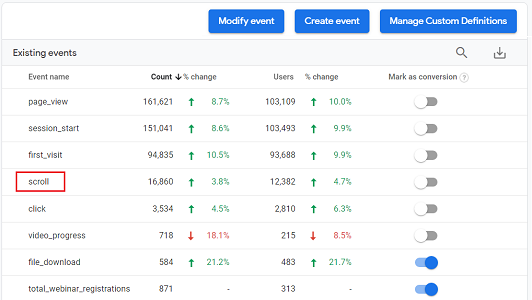
#13 You can get a detailed report for a logged event by clicking on its name in the events table.
For example, if you want to see a detailed report for the ‘scroll‘ event then just click on its name in the data table:
You should now see the detailed report like the one below:
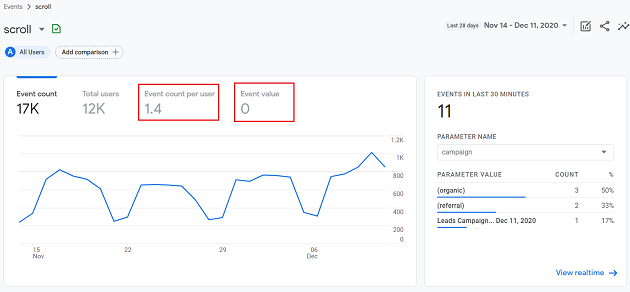
Here,
Event count per user denotes the average number of ‘scroll‘ events triggered per user.
Event Value denotes the sum of all ‘value’ parameters supplied with the ‘scroll‘ event.
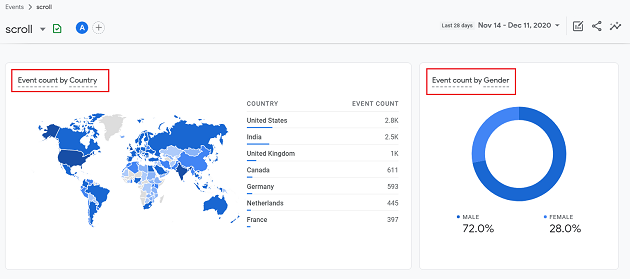
If you scroll down the report, you can see the ‘scroll’ event count by country and gender.